 |
 Survey 50 Topics:
 Time Spent on Social Networks
 Social Network Importance to Personal Life
 Most Trusted Information Sources

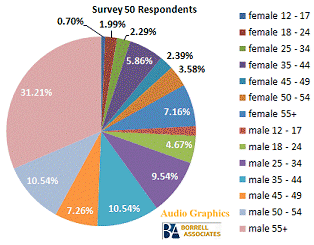
 Survey 50 respondents are 75.35% male and 23.96% female.
 The remaining did not give their gender.
 Note: Due to a number of popular "oldies" and "jazz" stations
 running this survey, relative to the U.S. population, a
 disproportionately high number of response was generated
 from the 50+ demo.
 We are soliciting format specific radio stations to bring
 respondent demos in-line with the U.S. population.
|
|


 Survey 50 covers a person's relationship with Social Networks, and "trust" in media.
 Of the time you spend online, how much is spent on the "social networks" like MySpace or FaceBook?
This first graph shows response for this question in 2008.
The majority spent 10%-20% of their online time in social networks.
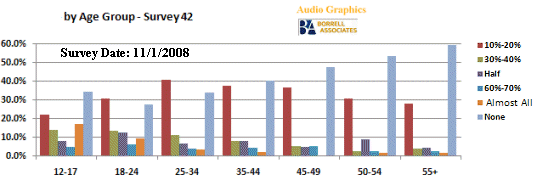 |
Two years later, there is little fluctuation in the 10%-20% response, but the number of persons who claim "none" decreased.
 |
To demonstrate the generation-split, this question's answers are divided into 12-44 and 45+ age breakouts - click here.

 We next look at the "importance" that social networks play in a person's social life.
 How important is the time you spend on "social network" websites to your personal social life?
This first graph shows response for this question today.
The younger the person, the more importance social networks seem to play.
 |
This graph shows the priority of social networking in online radio listeners' lives in 2008.
 |
To demonstrate the generation-split, this question's answers are divided into 12-44 and 45+ age breakouts - click here.

|
|
 Surveys are branded to the serving station.
 See
Survey 51


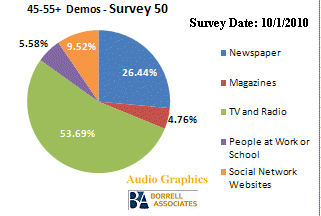
 Which do you most trust for information?
Question:
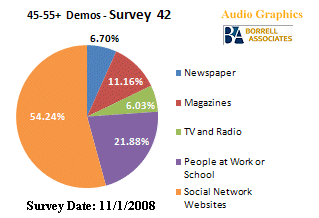
Considering sources of information available to you, which one of these do you trust the most?
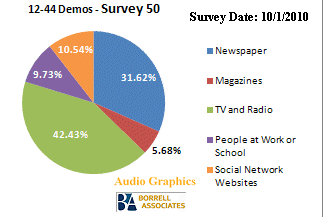
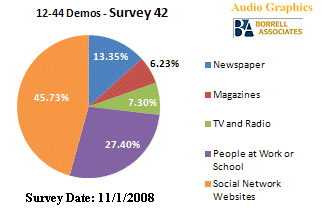
 Compare the above response to the same question,
 asked in 2008...
Here is what a group of 45+ persons said, when asked the same question: Considering sources of information available to you, which one of these do you trust the most?

In 2008, this is how the same age group of online radio audience listeners responded when asked the same question.
 |
To demonstrate the generation-split, this question's answers are divided into demo group breakouts - click here.

 About These Surveys
 Audio Graphics started this internet radio listener
 survey system in October 2001. It is the only continuous
 survey of the internet radio audience and is conducted
 in conjunction with leading research firm
Borrell Associates.
 For more information: Ken Dardis
 440-564-7437

 Survey 50 Participating Stations:
|
|


 The only continuous survey of radio's online audience... in progress since 2002.
 1,006 online radio listeners responded to Survey 50.
 Survey completed: October 11, 2010
 Survey 50 Topics:
 Time Spent on Social Networks
 Social Network Importance to Personal Life
 Most Trusted Information Sources

 Survey 50 covers a person's relationship with Social Networks, and "trust" in media.
 Of the time you spend online, how much is spent on the "social networks" like MySpace or FaceBook?
 We next look at the "importance" that social networks play in a person's social life.
 How important is the time you spend on "social network" websites to your personal social life?
 Surveys are branded to the serving station.
 See
Survey 51
 Which do you most trust for information?
 Compare the above response to the same question,
 asked in 2008...

 About These Surveys
 Audio Graphics started this internet radio listener
 survey system in October 2001. It is the only continuous
 survey of the internet radio audience and is conducted
 in conjunction with leading research firm
Borrell Associates.
 For more information: Ken Dardis
 440-564-7437
 Survey 50 Participating Stations:


