| Monday, March 11, 2013 |  |
 |
 |
 |
 |
 |
 
 
 |
 |


 A New Breed of Indie Artists
 Free Music and Programs for Radio and Podasters
Online Radio Industry Data Sets
|
It's always amazed me that people who work in terrestrial radio focus so heavily on data Arbitron provides them. Yet they appear oblivious to the simple fact that advertisers are moving more money online every month because of the data sets it delivers. The value of an advertising campaign can now be identified, and it's the online radio stations which will benefit most - especially the pureplay radio stations - if they begin to use the data. I'm not seeing a move towards any form of analysis, though, besides the buzz that's created each time Triton Digital releases its monthly Webcast Metrics reports. That's troubling, due to the value of what's publicly released within that report. In a word, it's worthless. |
"One statistic which I have not seen discussed by any radio industry trade - be it concentrating on terrestrial or pureplay operators - is the percentage of 'Average Active Sessions' resulting from "Session Starts.'" |
Let's discuss why there's no value to anyone except the company subscribing to these reports. Without detailing the data sets, knowing how many people are reported to be listening to Clear Channel, CBS Radio, Cumulus, etc., tells absolutely nothing when compared to a) each company and b) a month-to-month.
The reason for the above is not complex. No one knows what constitutes the makeup of the monthly numbers. Are they going up because the radio group added stations or improved programming? Are they going down because a few station streams were shut off? Has the Katz Network added clients, raising its totals? With the information provided to the public there's little to gain digesting these numbers, and certainly no definitive statements to be made from them.
For instance, has anyone explained that four of the five newest names in the Top 20 are based in Turkey (Karnaval.com); Madrid, Chile, Costa Rico, Columbia, and many more countries (Prisa Radio); The Netherlands (Sky Radio): and Spain (COPE)?
What's behind the 18.1% increase in Clear Channel's "Session Starts" between December 2012 and January 2013? Its Y-2-Y increase is 39.7%, but is that because more stations in the Clear Channel group are streaming, or is it due to more people listening to the same number of station streams? Within this information, all you're looking at are meaningless numbers. And don't just ask this about Clear Channel. The same questions can be used for any name on the list.
What about Average Active Sessions? A quick look at those using Clear Channel (only because that's the company we started with) shows a 7.5% lift Dec-Jan, with a 22.7% increase Y-2-Y. This could be impressive, if only we knew how the increase was acquired. But we don't, so it's not.
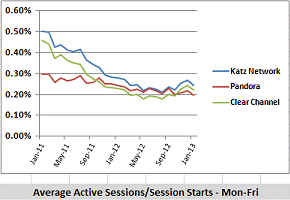
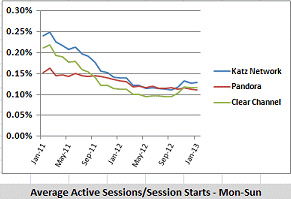
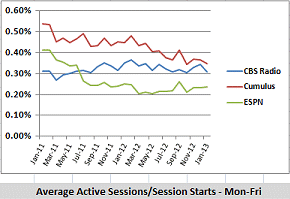
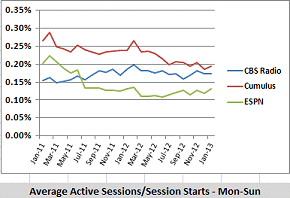
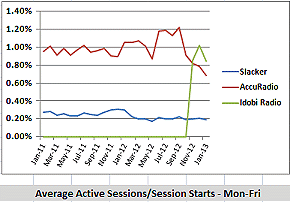
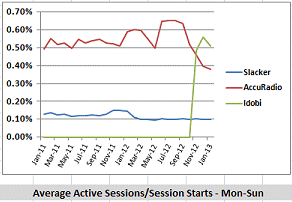
One statistic which I have not seen discussed by any radio industry trade - be it concentrating on terrestrial or pureplay operators - is the percentage of "Average Active Sessions" resulting from "Session Starts."
Looking at this "Percentage of Average Active Sessions Resulting from Stream Starts" gives you a grasp of how many people are sticking around after starting a stream. It's a consistent figure that's not dependent on how many streams are being counted.
Here are major points uncovered as I compiled these data sets: The percentages are small, and those for Monday-Friday listening are nearly double the percentages of Monday-Sunday listening. Said differently, adding two days to your data shows that people on the weekends are doing a huge amount of channel surfing when compared to the weekday audience.
We see a 0.20%-0.24% conversion of Stream Starts to Active Average Sessions for Katz Network, Pandora, and Clear Channel, Monday through Friday. Include the weekend data and it drops to 0.11%-0.13%.
The following graphs, and dozens more, are available to subscribers of our free monthly breakouts.
Request our free data breakouts of the January Webcast Metrics. You'll also receive a set of free data graphs showing the "Percentage of Average Active Sessions Resulting from Stream Starts."
 |
 |
 |
If you want to digest these numbers, subscribe to our free breakout and you'll see graphs for each of the top companies charted in ways unavailable to you from any other source.
This month, you'll also receive spreadsheets outlining the "Percentage of Average Active Sessions Resulting from Stream Starts."
Click here to receive a FREE breakout of this report sent to you for each month it is published. The Audio Graphics compiled numbers include all groups in the publicly-released Triton Digital Ranker.
Note: For caveats pertaining to this month's release, please view the bottom of Triton Digital's report.
While the broadcast side of radio has a near lockout on indie artists, introducing music is open wide to internet stations.
|
A Country artist to consider: Paul Tolle. |
 sample song |
Cougar Snack Download Song
|
Give Paul Tolle's "Cougar Snack" a listen.
Add it to your playlist, free! Such is the new world of music distribution.
The radio industry had its shot. It's time internet radio programmers take a chance and reach into a huge pile of talent. It is there that new hit songs will increasingly be found.
More Articles
 |
 |
 |
comments by Disqus |


