 Analytics, Metrics and Music for the Radio Industry
 An Indie Artist Pipeline to Internet Radio
 Radio Industry ROI Strategy
 A New Breed of Indie Artists
Webcast Metrics - What’s With Salem?
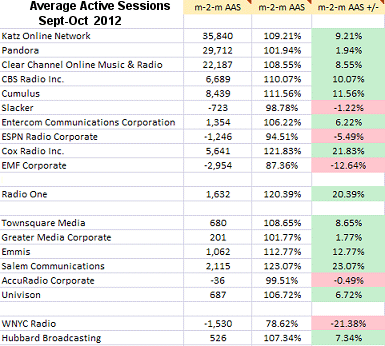
Triton Digital released its October Webcast Metrics Report. There's not much change in the lineup. Pandora, Slacker, and AccuRadio aside, this report shows the online radio industry overloaded with the same companies as in the terrestrial world.
There is growth in “Average Active Session” for 70% of the listed top 20 rankers. Though how much of this “growth” is attributed to expanding existing audience, as opposed to a company adding more stations, is unanswered.

As an example of the specificity that broadcasting online brings, view the AccuRadio listing in the above chart. Between September and October, the attribution of “Average Active Listeners” deviates by only 36 persons. (Note: AccuRadio’s ratings “Does not include mobile data.”)
| "I do the breakout for you, and show what the radio industry is doing online in more detail than is available from any other source." |
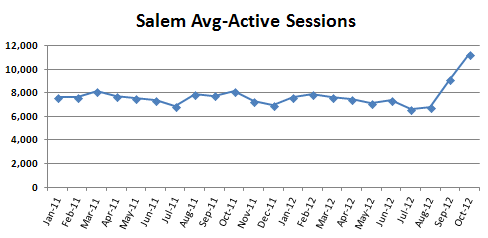
What’s catching my eye is the increase Salem shows - 6,793 in August; 9,169 in September; 11,284 in October. That’s 34.9% between August and September, and another 23.7% increase from September to October. Again, the unanswered question wraps around whether this is coming from attracting more listeners to Salem's online stations or from adding streams in its rankings. |
Each time a Webcast Metrics is released I put together the data in a way that allows you to see the deeper picture. Download this month's spreadsheets free.
Let’s look at the lift Salem has received after 20 continuous sub-8,000 “Average Active Session” months.

Concentrate on Salem’s “Session Starts” and we see growth of 220.2% August to September; 52.2% September to October.

Receive our breakout and you’ll see graphs for each of the top companies trying to make a go of this online radio industry.
Here's a look at the main chart, featuring the top four reported companies in Triton Digital's Webcast Metrics.

You'll find dozens of charts, outlining the position of each company within the report's top webcasters, by downloading Audio Graphics' Free Breakout.
Go here to download your free Audio Graphics analysis of the Triton Digital "October 2012 Internet Audio Top 20 Rankers." Get on this list and you’ll automatically receive an update each time a Webcast Metrics report is issued.
I do the breakout for you, and show what the radio industry is doing online in more detail than is available from any other source.
Click here to receive a FREE breakout of this report sent to you for each ranking month. It includes all groups in the publicly-released Triton Digital Ranker.
Note: For caveats pertaining to this month's release, please view the bottom of Triton Digital's report.


