| Tuesday, December 17, 2013 |  |
 |
 |
 |
 |
 |
 
 
 |
 |


 A New Breed of Indie Artists
 Free Music and Programs for Radio and Podasters
Step One: Know What You're Looking At
|
Triton Digital released its Webcast Rankings for October 2013. Listen close. This will be the last time we'll break out what's reported because: a) time's come for me to retire this workload, and b) too few people bother to learn what these numbers mean while the rest don't care to find out. |
"70.96% of Webcast Metrics' Average Active Sessions and 75.05% of its reported Session Starts in the Top 20 are generated by Pandora!" |
Let's take a quote from one notable radio industry writer who graces us with daily wisdom that is (in this case) not quite wise. To quote a comment on these new streaming numbers: "...'Average Active Sessions,' something akin to broadcast radio's average quarter hour metric."
Next, let's pull a quote from the Triton Digital Webcast Metrics report: "Average Active Sessions (AAS): Total Listening Hours (TLH) divided by hours in the reported time period." The same paragraph's next sentence reads: "TLH is defined as the total number of hours that the station/publisher has streamed during sessions with a duration of at least one minute in total within the reported time period."
I'm not sure how much more plain this can be made than to state, again, that the Average Active Sessions number has nothing to do with the number of people listening - and it is in no way "something akin to broadcast radio’s average quarter hour metric."
AAS, as Triton refers to it, is an increment of time divided by the total hours within the month being reported - in this case, October 2013 represents 744 hours. This time-not-persons is an important differentiation from what the radio industry calls "Average Quarter Hour."
I won't waste your time discussing how Pandora is out front of the other Top 20 companies reported by Triton's Webcast Metrics. I will, though, point to a few items you won't read about in a radio industry trade - starting with the total numbers in each reported category.

These are the Domestic, Monday-Friday Average Active Sessions and Session Starts. Go beyond a simple "Pandora is out front" comment and create something that speaks more of what's really happening. How about saying that of the reported Average Active Sessions (2,666,299), all but 774,317 belong to Pandora?
Seeking another eye opener? Try this: Of the 1,345,064,457 reported Session Starts, 333,626,095 come from every other measured streamer. The rest (1,009,438,362) are Pandora's.
Said another way: 70.96% of Webcast Metrics' Average Active Sessions and 75.05% of its reported Session Starts in the Top 20 are generated by Pandora! And we have dozens of other pureplay companies, serving tens-of-millions of listeners monthly, which do not report to Triton.
To help put this in perspective, all rated companies on this list (expect Slacker and Idobi Radio) have the power of thousands of radio stations to constantly promote their online streams. Pandora has none, unless you count KXMZ-FM in Rapid City, South Dakota, which it recently purchased. (Has that deal even gone through yet?)
A couple more charts to view show where "P" may be concerned, because these represent the Average Active Sessions Resulting from Session Starts (PAASRSS) for Pandora in the Monday-Friday and Monday-Sunday Domestic rankings.
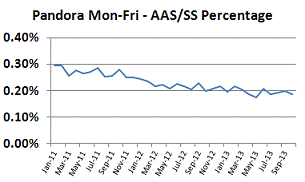

Notice how the former continues downward while the latter has a slight uptick over the past couple of months. The percentage of weekend PAASRSS is nearly half of Monday-Friday and shows that a smaller percentage of persons are sticking around on the weekend - regardless of huge Saturday and Sunday numbers.
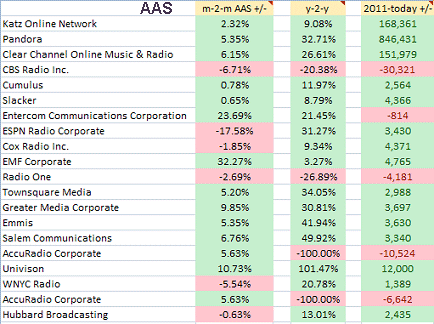
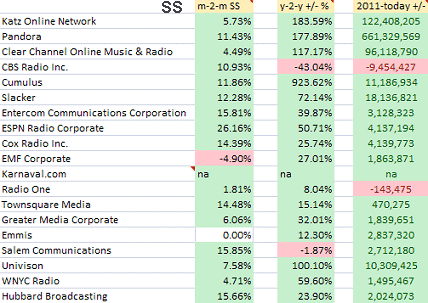
Now we'll take a quick peek at month-to-month, year-to-year, and compare October 2011 to October 2013 data. The charts represent, in order, Average Active Sessions, Session Starts, and Time Spent Listening.
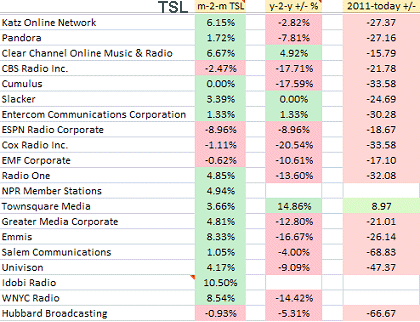
And to wrap up this month's report, here is time spent listening, shown in minutes, comparing October 2012 with October 2013.
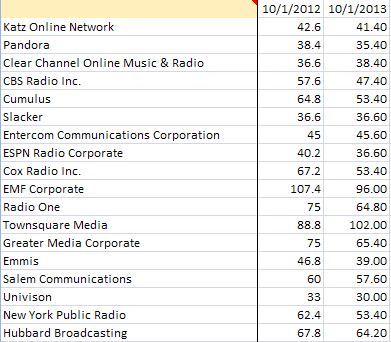
The radio industry is infatuated with numbers, and ratings seem to be the guideline. Yet radio appears unconcerned how these numbers are reported. As long as the radio industry seems to be gaining ground online, trade mags report all is O.K.
Study this, though. It's "Session Starts," including the Katz grouping of stations (now known as PROXi Digital Audio). When it's pointed out that Clear Channel holds 69.05% of the total number of Session Starts reported in the entire Katz lineup of stations, you should start asking yourself just how well the radio industry is doing online. That's not a question you'll find answered by reading trade publications supported by radio.
This is the last month I will provide a breakout of Triton Digital's Webcast Metrics reports.
While I used to think retiring meant putting new wheels on my car so I could drive farther, for me the meaning has changed. 2014 will be spent pursuing items of personal interest (and helping radio - online and off - understand how to best use the internet has ceased to be on that list).
Click here to receive a FREE breakout of this last report. Audio Graphics' compiled numbers include all groups in the publicly-released Triton Digital report.
Note: For caveats pertaining to this month's release, please view the bottom of Triton Digital's report.
Today's indie artist introduction is to...
| Spiritual music artist Skylar Kaylyn. |
 sample song |
Happy Ever After Download Song
|
Give Skylar Kaylyn's "Happy Ever After" a listen.
Add it to your playlist, free! Such is the new world of music distribution.
It's time for internet radio programmers to take a chance and reach into a huge pile of new talent. Online is where new hit songs will increasingly be found.
More Articles
 |
 |
 |
comments by Disqus |

